Visuals

Visuals: Alcohol by country

Different cultures have different relationships with alcohol. For instance, Italians tend to drink a lot of wine but have a very low level of alcoholism, as they usually drink a couple of glasses with lunch and dinner. However, Russians are known for drinking copious amounts of vodka, and nearly 15% of deaths in Russia are related to alcohol consumption.

In the East, South Koreans are known for signing business deals in bars and then drinking with each other under the table, while Vietnamese love their Bia Hoi (beer halls), where they spend most of their evenings drinking beer after beer with their friends.

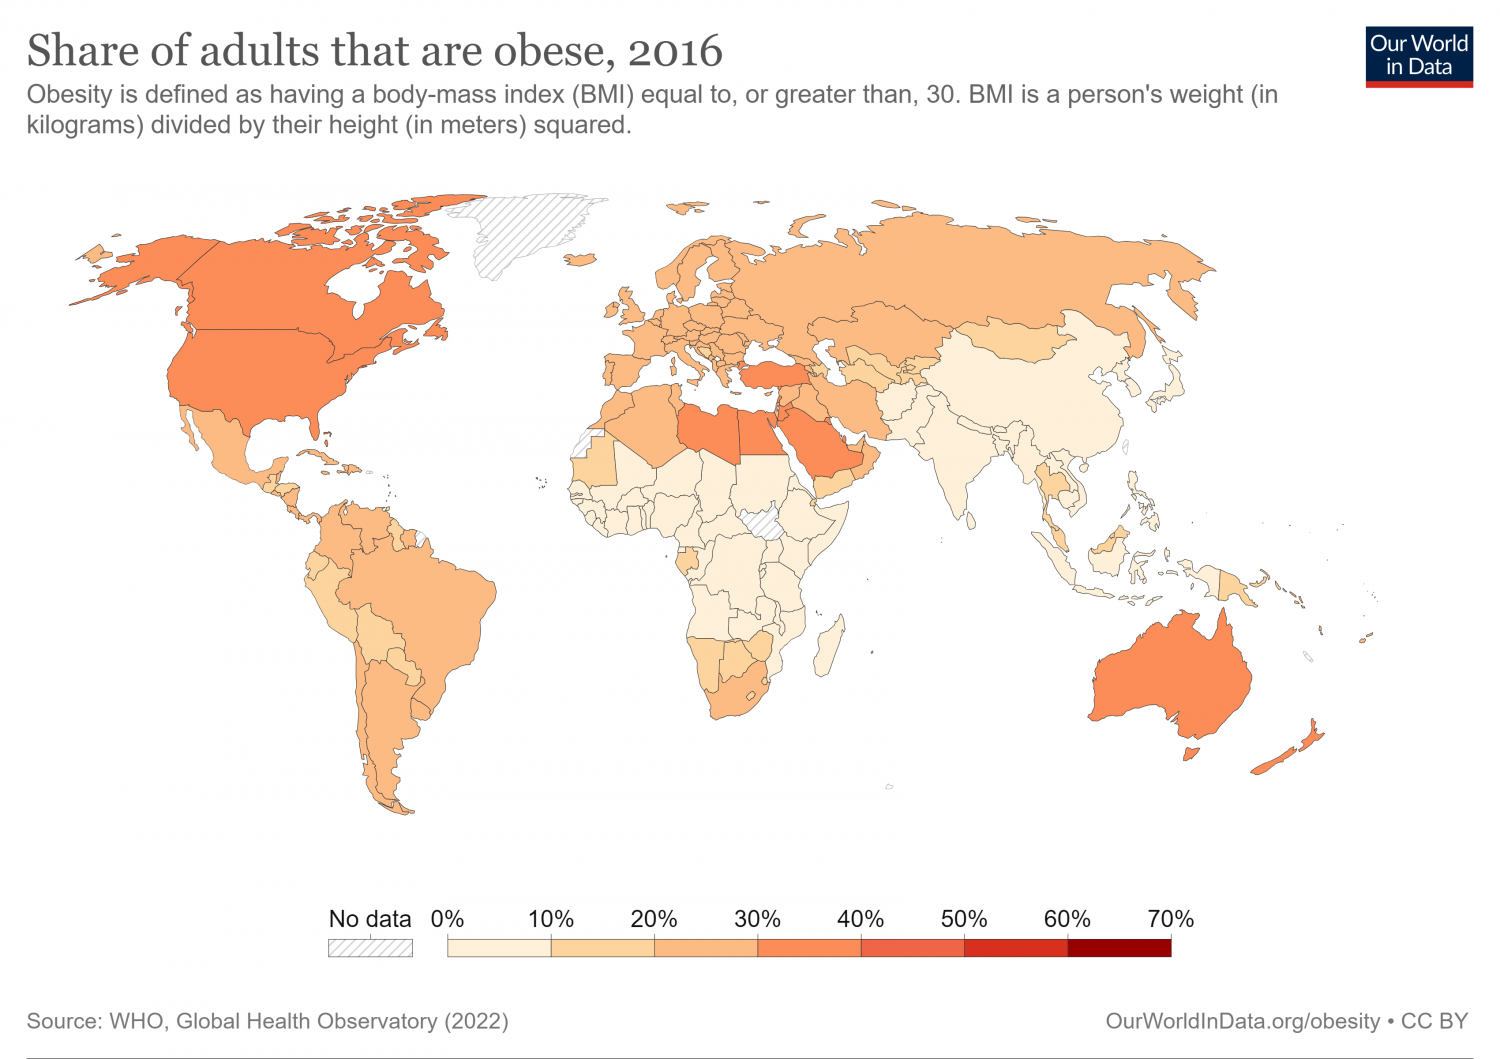
Visuals: Obesity around the world

Obesity is a growing problem around the world.

Obesity is defined as having a body mass index (BMI) of over 30. BMI is used to determine whether you are in a healthy weight range for your height. For instance, a person who is 180cm (5ft 11in) and 97kg (213lb) has a BMI of 29.7. 

The rate of obesity varies greatly around the world. Please have a look at the map below and discuss what you see with your teacher.

Visuals: World population increase

The world population has increased for most years over the past 120 centuries. Some notable exceptions were the Mongolian invasions, which reduced the world population by as much as 11 percent in the 13th century, and the Great Plague in the following century, which reduced it from 475 million to about 350 million.

During the early 18th century, advances in science and the beginning of the Industrial Revolution allowed the world population to skyrocket, as child mortality rates plummeted and life expectancy at birth increased gradually.

Have a look at the chart below and discuss what you see with your teacher.

Visuals: average height increases

People today are taller, on average, than their ancestors 100 years ago. This is true for every country in the world.

The data shown below is based on a global study. It reports mean height for adults by year of birth, from 1896 to 1996; in other words, people who had reached their eighteenth birthday from 1914 to 2014.

Please look at the graph and discuss it with your teacher.

Visuals: Cats, dogs or other pets?

The battle between cat and dog lovers is well-known. Some people love dogs. They say that dogs are friendly, loyal and active. Other people prefer cats. According to cat lovers, cats are independent, lower maintenance and cute. Some people choose very different pets, such as fish, birds, or rodents (e.g. rats, mice, guinea pigs).

Please have a look at the graph below. Discuss it with your teacher. 

Visuals: Threat of extinction

Over 900 animal species have gone extinct since the year 1500, and many more are threatened with extinction.

Extinction means that an entire animal species dies. For instance, the Dodo bird, a flightless bird that used to live on the island of Mauritius, went extinct in the 18th century because of overhunting by humans.

Please have a look at the graph below and discuss what you see with your teacher.

Visuals: Researchers in the world

For years researchers argued about the "Nature vs Nurture" question. Is a person talented because they were born that way, or did people and circumstances in their environment cause them to develop certain skills?

While this question stays open, there is little doubt that living conditions do matter. Could Steve Jobs have created Apple if he was born in a village in Africa? How much new technology or how many groundbreaking discoveries are we losing because talented children in poor areas don't have access to adequate education?

Please have a look at the graph below and discuss what you see with your teacher.

Visuals: Children's dream jobs

Adecco, a Japanese company providing human resource services, conducted a national survey asking 900 elementary and junior high school boys and girls what job they wanted to do when they grew up. Many children showed an interest in jobs that involve digital technology, which is no surprise since they have been surrounded by the technology since birth.

The detailed results of the survey are shown below.


elementary [adjective] /el-uh-MEN-tuh-ree/—simple or early stages of studying

Visuals: Nature Magazine evolves

Nature Magazine is one of the world’s most important international weekly scientific journals. According to its website, it publishes “peer-reviewed research in all fields of science and technology on the basis of its originality, importance, interdisciplinary interest, timeliness, accessibility, elegance and surprising conclusions.”

The first issue was published in 1869. Since then, the magazine has changed quite a bit. Have a look at the graph below and discuss with your teacher how the content has evolved over the past 150 years.


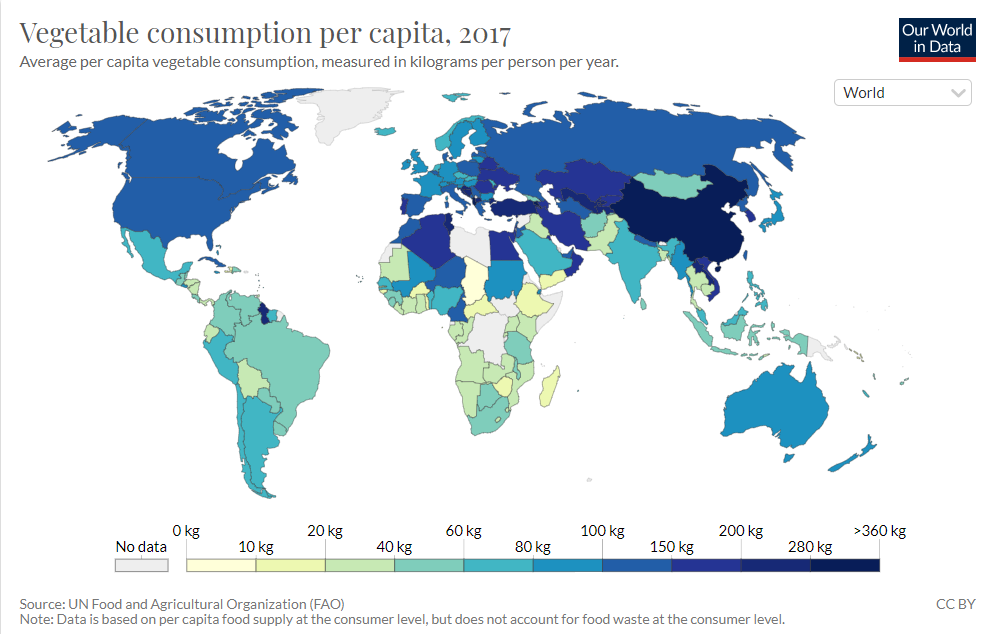
Visuals: Fruit & Veggie consumption

People’s diets have varied considerably around the world, and have often been dictated by geography, the types of crops that the land can sustain and animals that dominate the ecosystem. However, with advances in technology and globalization, billions of people can now eat all sorts of fruits and vegetables out of season, as well as exotic, imported meats.

Take a look at the two maps below and discuss what you see with your teacher.

Visuals: Racism in football

European football (soccer) has a history of racism. Recently, there has been a rise in racist comments from fans against players of color. Many football clubs are taking action against it. There are even projects involving computer- and A.I.-assisted technology to pinpoint racist fans.

But fans aren't just shouting abuse at matches; they're using social media as well. A 2021 study of online messages against the U.K's Premier League players found more than 3,000 abusive messages, 56% of which were racist.

So, how are social media platforms responding? Are they doing enough? The graph below shows what fans across Europe think.

Visuals: Global Income Distribution

The World Social Report 2020, published by the UN Department of Economic and Social Affairs, shows that income inequality has increased in most developed countries and some middle-income countries, including China. Inequality is growing for more than 70 percent of the global population, exacerbating the risks of divisions and hampering economic and social development.

Have a look at the chart below and discuss what you see with your teacher.

Visuals: forming musical tastes

Music can connect people everywhere. It can cross languages, countries and cultures. It can raise your mood, calm you down or give inspiration. But have you ever wondered when your music taste was formed?

A recent New York Times analysis of Spotify found out that the music we listen to when we are teenagers sets our musical preferences for the rest of our lives. 

That might explain why there is a generation gap in musical taste between parents and their children. It is difficult for parents to change their own musical tastes which were set years ago. Their children’s preferences, on the other hand, is still forming. 

Please have a look at the chart below. Discuss what you see with your teacher.

Visuals: The death of cinema?

Did you watch the 93rd Academy Awards ceremony this year? Chances are you didn’t, and you weren’t alone. The 2021 edition was the least viewed and lowest rated in the award show’s history, according to Nielsen Ratings. Take a look at this graph from CNBC below: 

The 2021 ceremony saw a staggering 56% drop off in viewership from the previous year, which was itself already one of the least viewed shows in Oscar history. Now of course, these are just award shows. What about Box Office numbers? IMDB reports that the global cinema gross in 2020 was $2.1 billion, a loss of over $9 billion from 2019.  

Visuals: Cigarette sales in the US

Around 18 billion cigarettes are sold around the world every day. In the United States alone, it is estimated that cigarette-related healthcare costs exceed USD $300 billion per year. However, the sale of cigarettes in the US has had an interesting history over the past century.

Please have a look at the chart below and discuss what you see with your teacher.

Visuals: Computer games heroes

When computer games appeared, men were their target comsumer. Games were created for men, and the main characters in games—protagonists—were mostly men too. Women were mostly presented as characters who needed help. For instance, Mario and Princess Peach. 

Recently, the gaming industry has started targeting women too. More female protagonists are appearing.

Look at the graphs below and discuss them with your teacher.

Visuals: Time we spend on phones

Since smartphones first connected us to the Internet, the time we spend on our phones has been increasing. 

2020 showed us that our whole life can be on the Internet. It is no longer a tool to work. It is something that gives us a voice, an opportunity to build relationships and connect with people. Some people find this useful. Others are worried about developing Internet addiction—when people use the Internet so much that other areas of their lives are damaged (relationships, work, studies, etc...) The American Academy of Pediatrics even proposed the idea of Facebook Depression. It is when people compare themselves with what they see on mass media platforms, and they feel incomplete, depressed and unhappy. 

Most of us have the Internet in our pocket at all times. That means our media consumption and screen time has changed significantly over the last decade.

Please have a look at the graph below about American media consumption.