Talk about numbers and percentages
Image Credit
大きな数、パーセンテージ、比較といった数字に関する表現に取り組みます。
Introduction
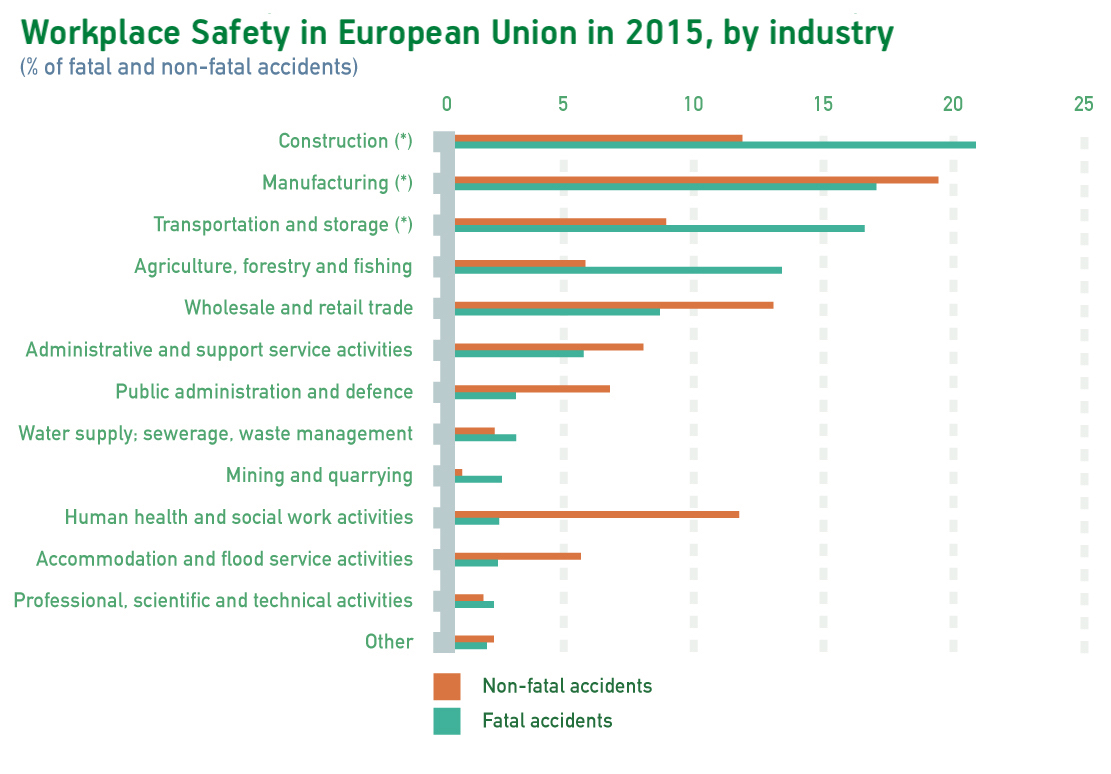
Describe the graph below. Use numbers as much as possible.
Warm Up
How comfortable are you reading and using numbers?
Language
A. Big numbers
Read out the numbers below.
- 1,350
- 170,000
- 1,700,000
- 1,070,000,000
- 10,912,094,809
B. Fractions/percentages
- Match these percentages on the left (1–5), to the fractions on the right (a–e).
| 1. 50% | a. nearly a/one quarter |
| 2. 24% | b. just under three-quarters |
| 3. 74% | c. approximately a/one third |
| 4. 33% | d. half |
| 5. 10% | e. a/one tenth |
- How many ways can you describe this number: 25%
- one in f________
- a q________
- one out of f________
- one out of every f________
C. Comparatives and superlatives
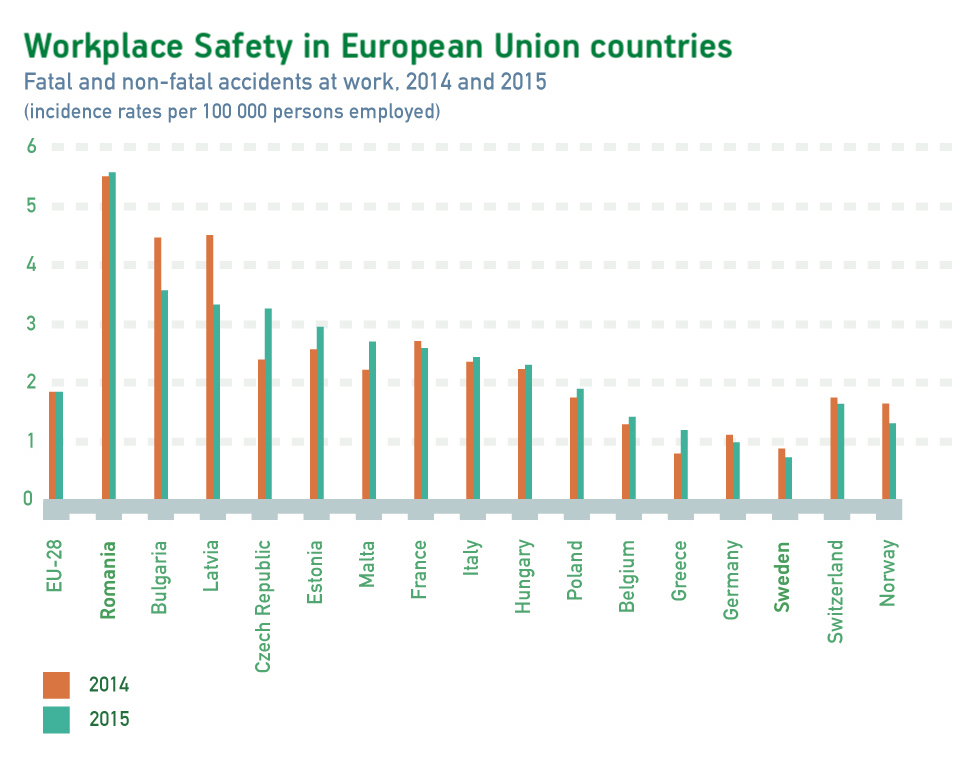
In lesson 17, we discussed the benefits of comparing two graphs. You can also compare information in one graph. Use the phrases below to complete the sentences, describing the graph in the Introduction.
- (by far) the most
- In 2015, Romania had...
- (by far) the fewest
- In 2014, Greece had...
- (far) more [A] than [B]
- Latvia had...
- (far) fewer [A] than [B]
- The Czech Republic had...
- nearly [number] times more
- Compared with Greece, Romania had...
Practice
Present this graph to your teacher.
Make sure you give a clear overview using the skills and language you learned in lessons 17 and 18. Then describe the graph in detail using language from this lesson.