GCAS 18 プレゼンテーション:トランジションとディレクション

White person's hand pointing at a graph on a laptop screen

Take a look here

トランジションを使って、聞き手の注意をひきます。

Introduction

Here are two graphs. Take 90 seconds to give an overview and highlight key points.

Set a timer for 1:30 (90 seconds), or just keep track of the time on your phone or with TimeandDate.com's online stopwatch.

The student should use the skills they picked up in the last lesson.

  • What does this graph show?
    • Education of adult women in the labor force in 1970 and 2010.
  • How is it measured?
    • Percentages.
  • Any key point?
    • In 1970, some college + graduated from college = about 22%, so less than one quarter had been to college at all.
    • In 2010, some college + graduated from college = about 67%, so more than two thirds had been to college.


Warm Up

Your teacher will give two short presentations on the graphs, above.

What's the difference? Which one is easier to understand?

Example 1: Hard to follow (no directions)

Just a little over one quarter of women had graduated from high school but not gone to college in 2010. That's 26.4%. But 43.3% of women in the labor force had graduated from high school but not gone to college in 1970.

  • In this example, there are no clear directions or transitions.

Example 2: Easy to follow (with directions, in italics)

Let's start on the left, the graph showing 1970. In red, you can see about one third of women, 33.5%, had not even graduated from high school. Now compare that to the right-hand side, again in red. It drops to only 6.8% in 2010.

  • This example has directions and transitions (in italics).
  • Ask the student,

Was the second easier to follow? Did it use the graph more effectively?

Further info to illustrate this point

Q: Why use graphs in presentations?
A: To clearly show information.

So, if you give the information without the graph, you are trusting your audience to connect the information to the graph. That might be fine in an internal presentation with your team.

But, if you give information while directing attention through the graph, you can be sure everyone will follow.

Language

A. Phrases for location

  1. On the left/right...
  2. On the far left/right...
  3. At the top/bottom...
  4. In the top left/bottom right...
  5. Shown in red/blue/purple/etc.

Practice: Use each of the phrases to direct your teacher's attention to a part of the graph above. Your teacher will read the information in that area. For example:

Student: On the far right, shown in gold.
Teacher: 26.4%?
Student: That's right.

B. Phrases to move ahead 

  1. Take a look at the graph on the left/right...
  2. Compare that to the next/previous/other graph.
  3. Next, turn your attention to this graph. We can see...
  4. Let's move on to...

Practice: Select key information from the graph above. Direct your teacher using these phrases.

A: Phrases for location

  1. On the left/right...
  2. On the far left/right...
  3. At the top/bottom...
  4. In the top left/bottom right...
  5. Shown in red/blue/purple/etc.

Practice: Use each of the phrases to direct your teacher's attention to a part of the graph above. Your teacher will read the information in that area.

Example:

  • On the far right, shown in gold.
    • 26.4%
  • In the bottom left area, also shown in gold.
    • 43.3%
  • On the far left, in purple.
    • 10.9%

B: Phrases to move ahead 

Go through each phrase with the student and have them practice saying it naturally.

  1. Now, take a look at the graph on the left/right...
    • Used to start.
  2. Compare that to the next/previous graph.
    • To add information.
  3. Next, turn your attention to [this graph.] We can see...
    • To add information.
  4. Let's move on to [the other graph]...
    • To add information.

Practice: Select key information from the graph above. Direct your teacher using these phrases.

If necessary, help your student choose information:

  • Take a look at the graph on the left. In blue, you can see...
  • Compare that to the other graph. Again in blue you can see...
Practice

Look at the graph below.

Use the skills you have learned to direct your teacher's attention around the graph.


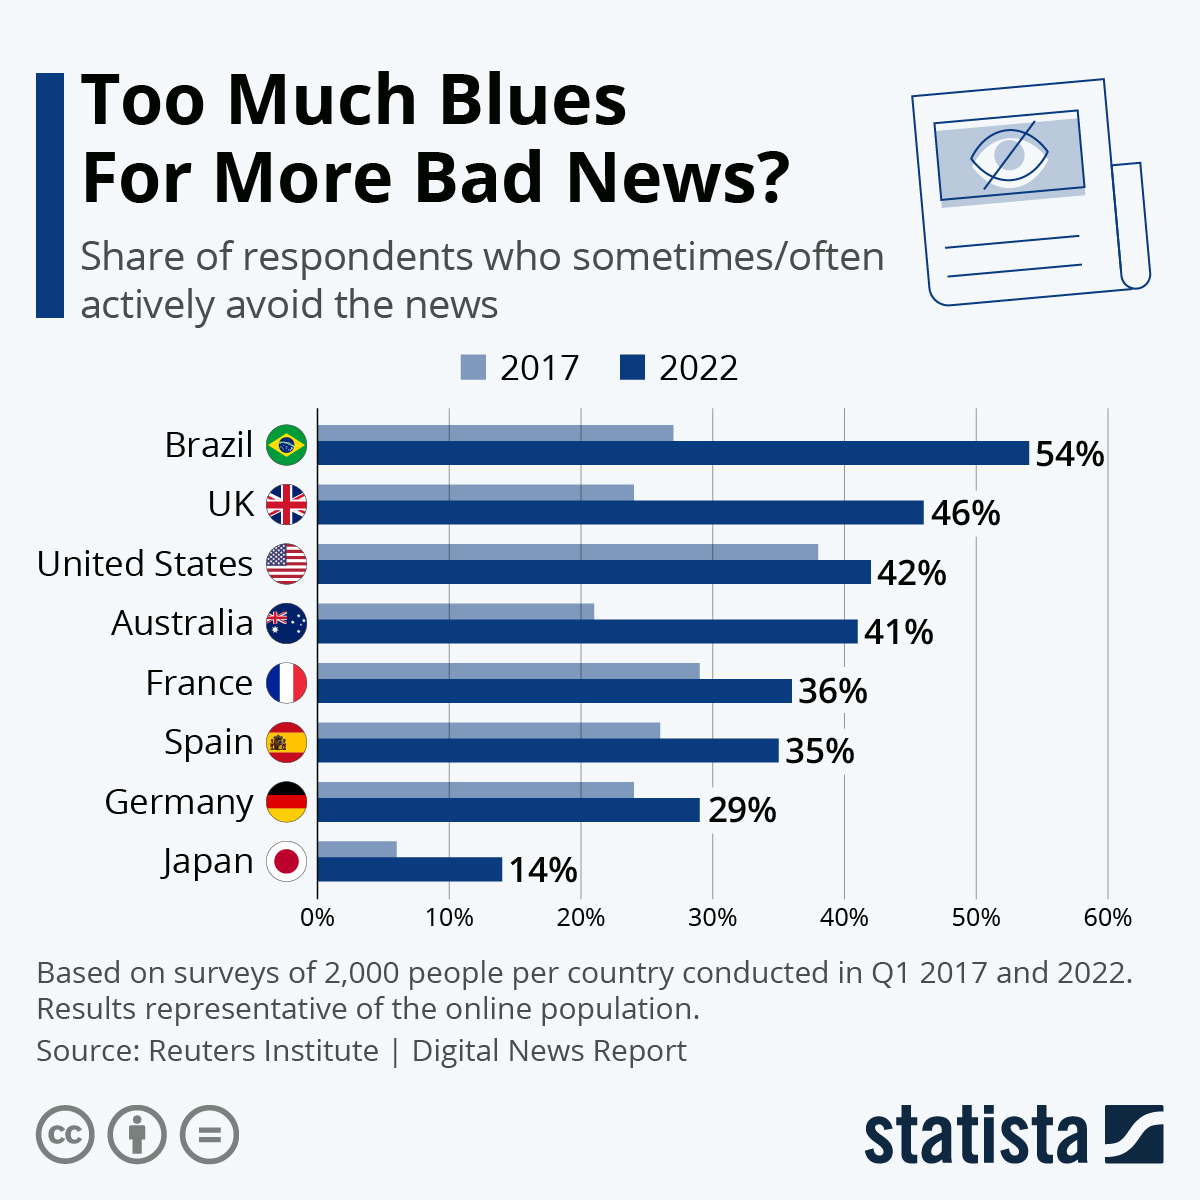
[For more on the graph, see this discussion post from The English Farm: "Visuals: Avoiding the news".]