
Prepare by noticing key points
In this lesson, we'll work on understanding graphs, noticing key points and preparing well.
In the GCAS, you have 90 seconds to prepare for your presentation. Try that now.
Your teacher will time you. Do your best to understand all the key points from this graph.
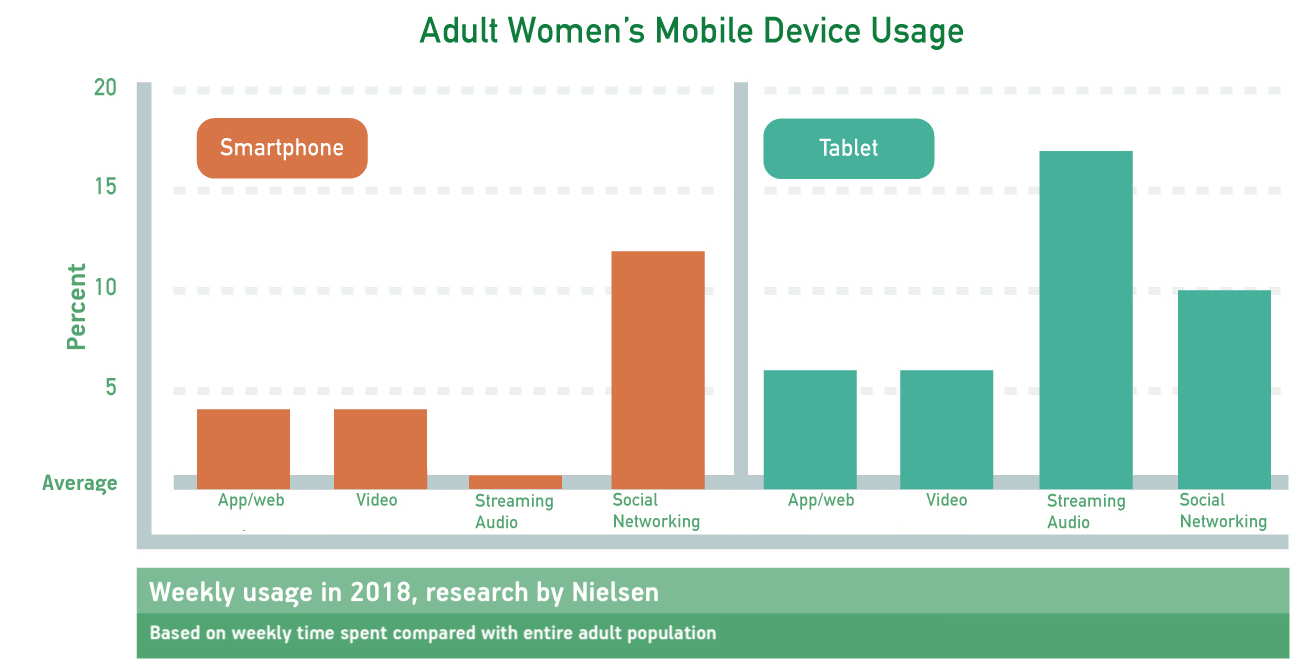
How should you prepare before presenting a graph?
A. Gather information
The first step is to read the graph.
With your teacher, answer the following questions about the graph above.
- What does the graph measure?
- Note what, who, when, and where.
- How does the graph measure it?
- Is there a time element?
- Are two (or more) things being compared?
Practice: Present the information above in your own words. If you have trouble, your teacher can help.
B. Find a general trend
The next step is to understand, in general, what the graph means.
- Is there a general trend in the graph above?
Practice: Present the general trend in your own words. If you have trouble, your teacher can help.
C. Find a takeaway
The final step is to select one (or more) point(s) to highlight.
- Is there a key takeaway from the graph, above?
Practice: Present the key takeaway in your own words. If you have trouble, your teacher can help.
Look at the graph below.
Take 90 seconds to read the graph, notice a general trend and select a key takeaway. Then present the information to your teacher.
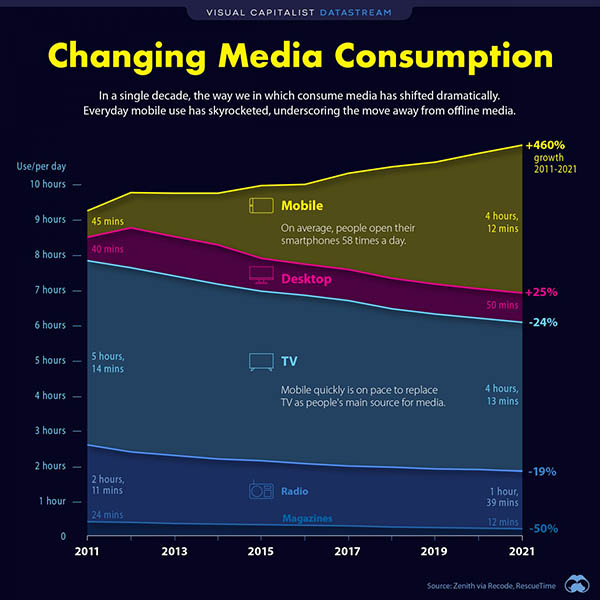
[For more on the graph, see this discussion post from The English Farm: "Visuals: Time we spend on phones"]